Introduction
How does it come to your attention that a recently upgraded software product is crashing or failing across your company? Is it the first line supporters who spots a trend in a increasing number of incidents regarding a certain software product?
What if you could spot a problem as it happens – what if you could drill down to the exact error and read the event log file? Look no further – with CapaOne Reliability from CapaSystems you get the birds eye view of the computers in your organization with graphs to show you the computers with the highest to lowest reliability score.
Average Reliability Score
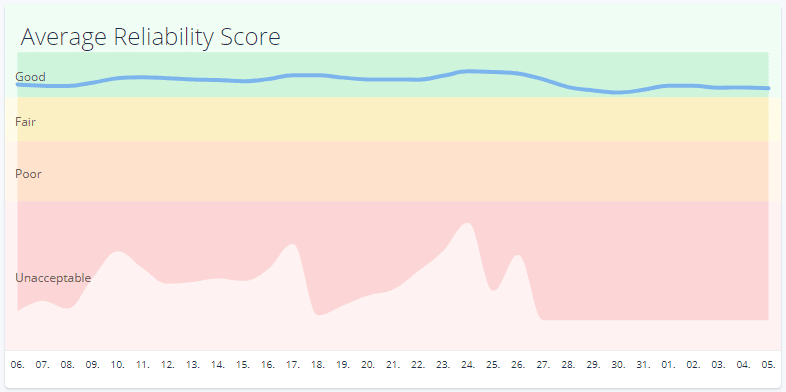
In the “Average Reliability Score” you can see the general health of your computers. The blue line indicates the average reliability of the computers. The green, yellow, orange, and red part indicate the levels of reliability. Notice that the red part of the graph from the 6th. To the 27th. looks a profile of a Tour de France mountain stage – that’s because the graph indicates 10 in the top of the green part of the graph and 1 at the bottom. When any part of the graphs isn’t fully painted it means that the top of “mountain” is the lowest reliable computer in your organization. So ideally you want that mountain as high as possible.
Identifying the Issue
As you can see on the graph above something happens on the 27th. of the month – the lowest reliable computer drops to 1, which indicates that something is wrong. The line that indicates the average reliability score dips a little bit, and that’s good. Because that tells us that it isn’t a majority of the machines that are experiencing problems.
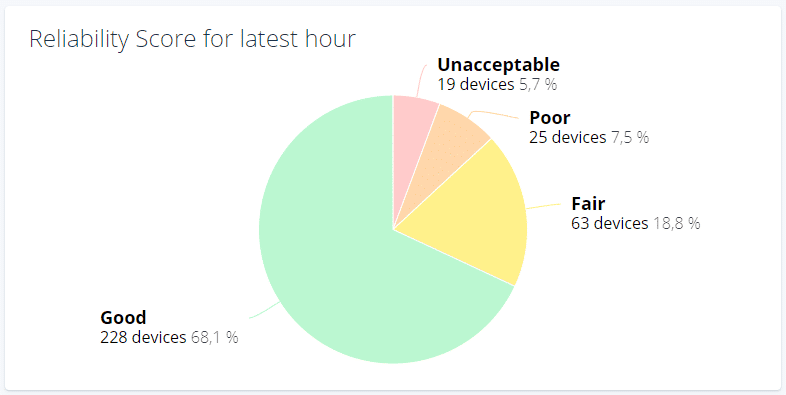
In the circle diagram it is confirmed that it isn’t all of the computers that experience problems – just 5% – which isn’t many, but if it is a customer related group of employees that experience problems with something like a communication platform, then it’s bad for business.
In the detailed view you can see that the errors started occurring around the 27th. of the month – as previously discovered. In this graph you can see that both the informational events and the errors skyrocket. There are still errors in the weekend – on the 30th. and 31st, but not significantly many.
The 1st. of the month the errors and informational events are back in full force.
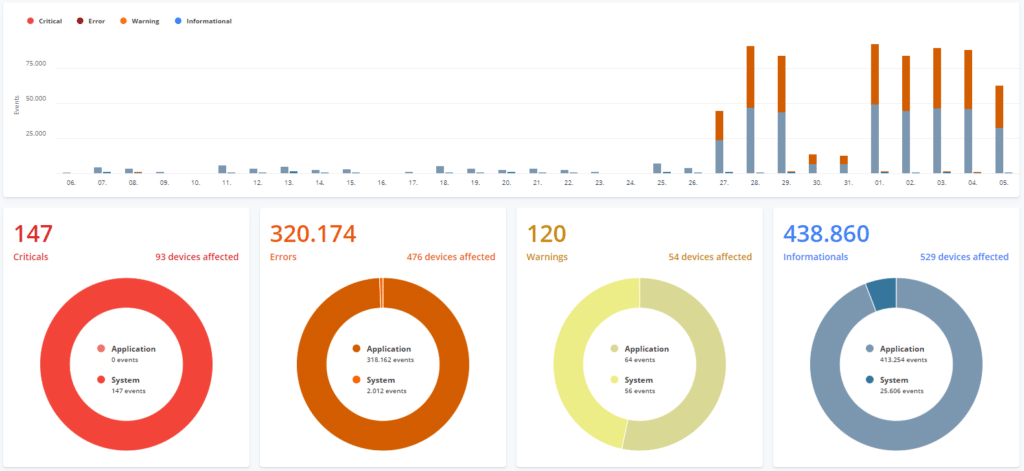
In the circle diagram it is very clear that the errors are caused by an application, and if we click on the Applications part of the Errors circle graph, we can clearly see which application is causing the errors on the computers.
Isolate the Issue
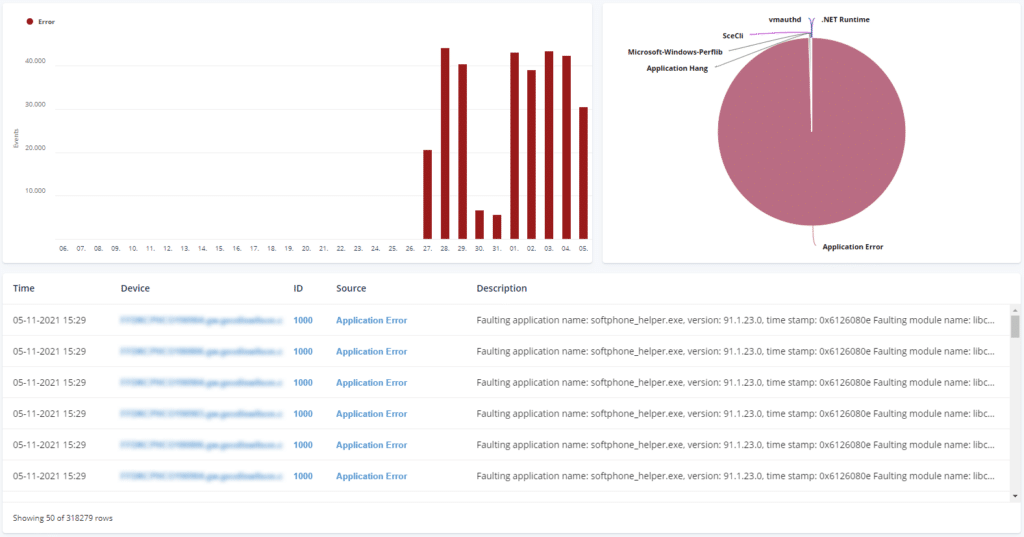
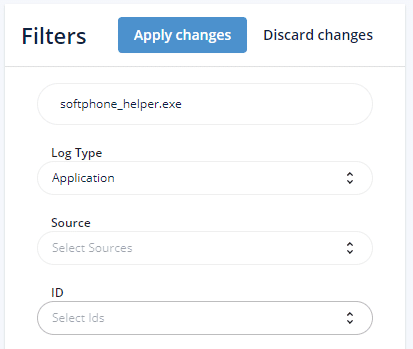
To isolate the issue, we can filter the event logs with any word in the description field – like the name of an executable or a version of an executable.
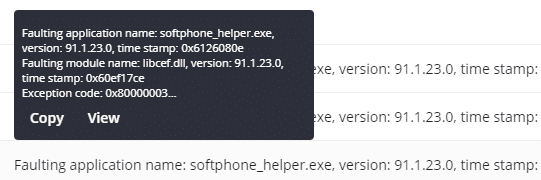
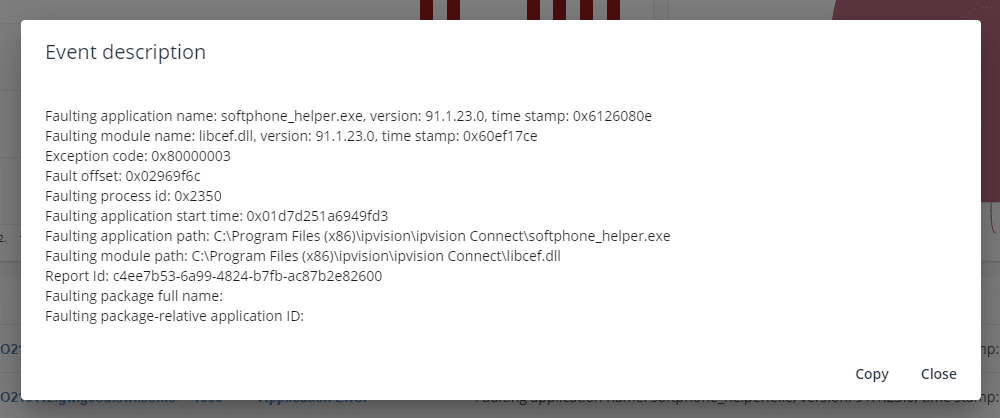
To view the entire event log, you can hover the mouse over an event and either click the Copy button to copy the contents of the event to the clipboard or view the event in the browser.
It’s as easy as that. From identifying an issue from a bird’s eye view to isolating the error as a technician with as little actions as possible.
If you want to know more about the CapaOne Reliability, please visit www.capasystems.com/capaone-reliability/
Or call +45 70 10 70 55
By Lars Olsen, Consultant