Windows Performance Counters: This blogpost will help you to understand, how you can monitor Windows Performance Counters in PerformanceGuard
Is it possible to collect too much information about your servers or computers? No – not really, right? Information is power, and more information equals more power. And one way to collect information is to use Windows performance counters.
PerformanceGuard comes packed with many built-in performance counter templates, but sometimes it is just not enough. Here is a guide that will help you create your performance counter templates to get inside the details of the server/computer you are monitoring.
Let us dive into the wonderful world of Windows Performance Counters.
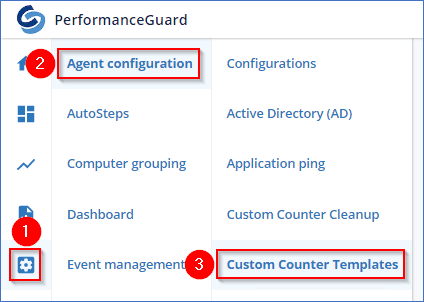
1. Select the Administration gear icon
2. Select the Agent configuration menu item
3. Select the Custom Counter Templates sub item
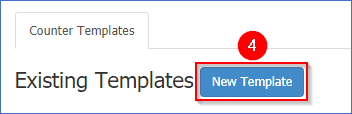
4. Press the New Template button
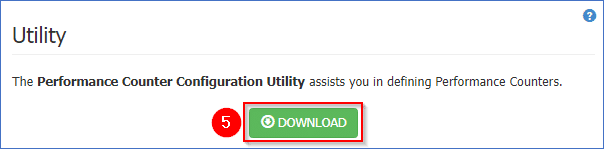
5. To examine the available Windows Performance Counters on a server, you need to download our Performance Counter Configuration Utility.
Press the Download button
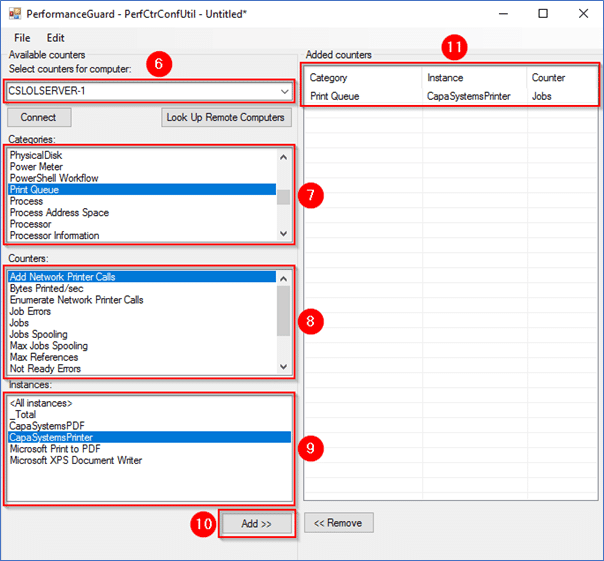
Once the application is downloaded, run the Performance Counter Configuration Utility as administrator.
6. Type the server name which performance counters you want to analyze
7. Browse the custom counters categories found by the client and select one
8. Select a counter of your interest
9. If more instances are available, select one
10. Add the selected counter
11. Here you can see all the counters you have added
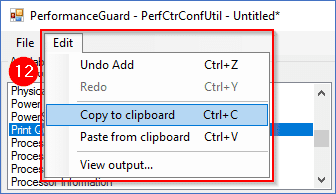
12. When you are done adding counters to your template, select Edit and Copy to clipboard
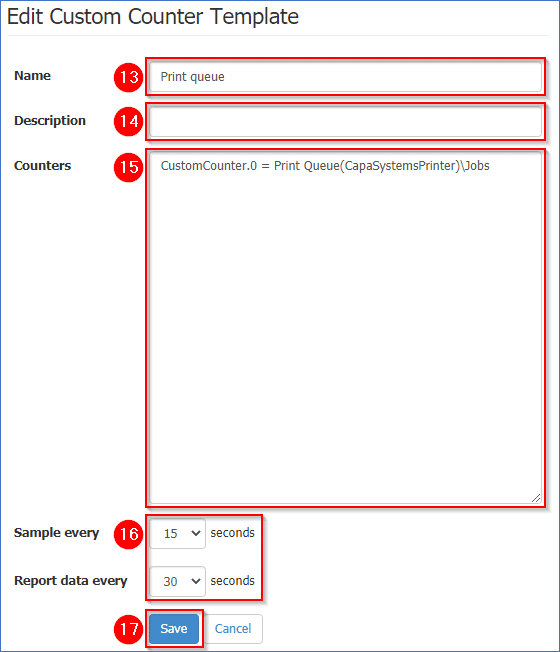
13. Find a name for your custom counter template and type et here
14. Write a description of the custom counter template for easier identification in the future
15. Paste the contents of the clipboard into this field
16. Set a sample and report rate at which the custom counter is monitored – the lower, the more stress it puts on the host
17. Save the custom counter template
You have created a custom counter template, but you still need to assign it to a server.
You have to consider how many agents are assigned with this counter because the amount of data collected by this custom counter template will increase your database’s size if you are not careful.
Suppose you add very common things like memory or disk counters to your custom counter template. In that case, you should consider assigning the custom counter template to a small number of agents, since every computer has memory and disk performance counters.
If you select a SQL performance counter, you could assign it to every server, because a standard server would not have the SQL performance counters required for your template to work.
I would recommend that you create groups for your custom counter template collections, especially if they collect many performance counters.
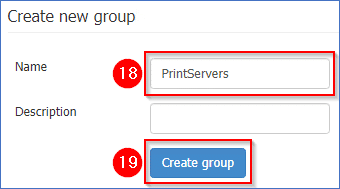
Let’s create a new configuration group to assign the new custom counter template.
18. Select a name for your new agent group
19. Save the group
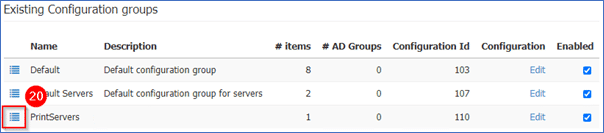
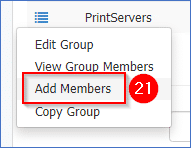
20. Press the little menu icon left of the new group name
21. Select Add Members
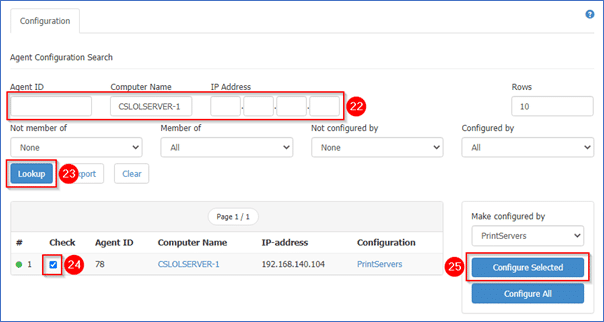
22. There are several methods to search for members to add to the group, Agent ID, Computer Name, or IP address
23. Once you have typed in the required information above, Press the Lookup button
24. Select the server
25. Presse the Configure Selected button
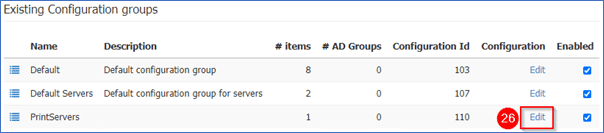
26. Edit the Agent configuration group
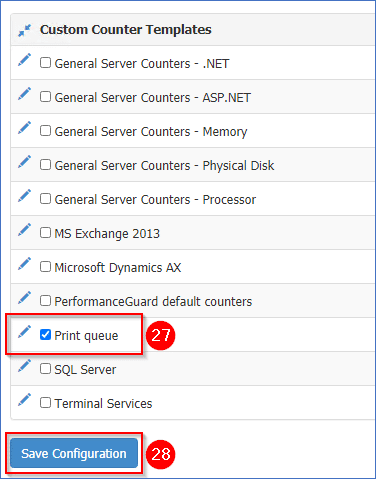
27. Scroll all the way down to the bottom, and set a checkmark in the new custom counter template
28. Save configuration
What happens now is that the new configuration is sent to the servers in the configuration group, and they start to report on the Windows performance counters. This process can take up to 12 minutes.
Once data is starting to flow into PerformanceGuard, you can monitor the data in a dashboard widget. Here is a short guide that shows how to monitor data collected by custom counter templates.
Start by creating a new dashboard, or edit an existing, add the widget Computer Chart.

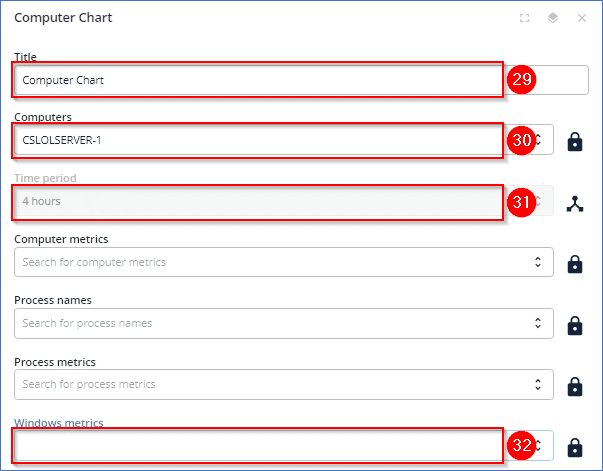
29. Add a title to your chart, or leave it empty
30. Select the server(s) that you assigned earlier to the new agent configuration group
31. Select a period, or leave it as Inherit
32. Press the empty space to show the following dialog
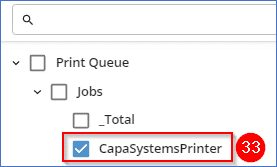
33. Select the new Windows performance counter from your custom counter template.
If you do not see any options on this menu, that means that no data has been collected yet.
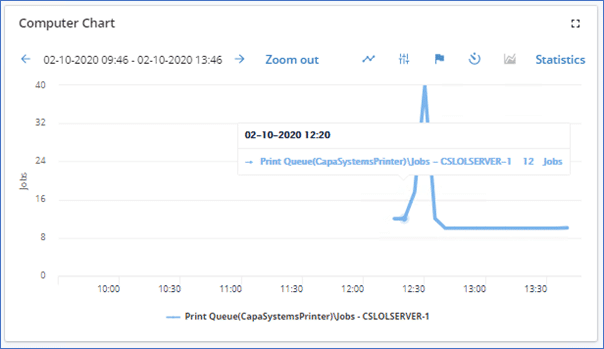
In this example the number of print jobs are shown in the graph below.
The possibilities with Windows Performance Counters are almost limitless, and the amount of information collected can prove vital to your company.
I hope that this blog has inspired you to explore the world of Windows Performance Counters in PerformanceGuard.